


The Breker Trekker Adnan Hamid, CEO of Breker
Adnan Hamid is the founder CEO of Breker and the inventor of its core technology. Under his leadership, Breker has come to be a market leader in functional verification technologies for complex systems-on-chips (SoCs), and Portable Stimulus in particular. The Breker expertise in the automation of … More » Understanding Portable Stimulus GraphsSeptember 13th, 2017 by Adnan Hamid, CEO of Breker
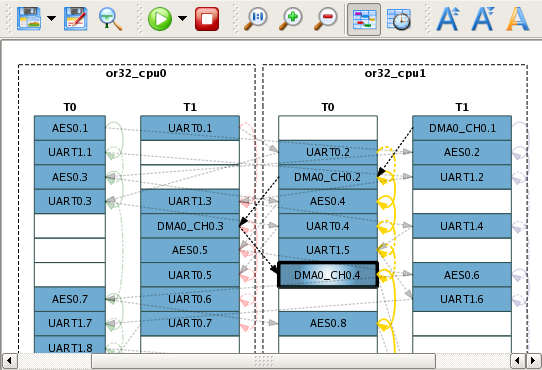
When people talk about the Portable Stimulus Standard (“PSS”) they throw around the term “graph based” as if that somehow clarifies everything. They usually don’t bother to describe what it means, beyond it being some simple mathematical model. Some vendors even confuse it with the term “graphical”. To simplify this confusion, for this blog we will use the term “visual”. This blog will answer questions about how PSS relates to graphs and how those graphs relate to other similar graph-based models already used within the industry. Let me make one thing very clear to start with – PSS does not define a visual representation of the graph model. Two input formats are being defined and both of those formats are textual. They both describe the same graph model. The graph model defines the semantics of the standard and the input formats are the syntax for writing those semantics. One of those input formats is a domain specific language (DSL) and the other is based on C++. Tools may provide a visualization of that model, but this is not defined by the standard. Portable Stimulus is hardly the first area within EDA to be based on graphs. Flow charts are a form of graph, as are UML activity diagrams, Petri nets and anyone who has done work on DSPs and pipelining will be very familiar with dataflow graphs. All of these graphs contain some basic elements such as Actions, Input/Outputs, Transitions between actions and data that flows between Actions. Each model defines rules such as when an action fires or executes. Each graph model is augmented with things that enable specific problems to be solved. As an example, with dataflow graphs, tokens move along the transitions. There are specific rules about when tokens are generated and when they are consumed. A certain action may be triggered when it has gathered enough tokens and will produce a single token when it completes. The dataflow graph can then be analyzed to find things such as maximum buffer depths required, if stalls will ever happen, throughput etc. Others graphs, such as the UML activity diagrams, include constructs such as fork/join and if/then extensions. Many graphs are statically analyzable although certain aspects of some graphs, such as timing in flow charts, cannot be known without dynamic execution. The graph model used for PSS show the greatest similarity to UML activity diagrams. These have been is use for several decades, particularly by the system design and the software development communities. The fact that software has become a necessary part of a modern SoC means that these two communities and the verification team will be working a lot closer together than they are today. This is also why one of the languages being used to describe these models is C++, and it is the language preferred by most users in the Accellera committee. For readers who are interested in the mathematics behind graphs, TutorialsPoint provides a good overview. PSS adds a couple of notions to general graphs, some of which were inherited from activity diagrams. Hardware can usually execute many things concurrently and this means that the graphs need to be able to indicate when things can run in parallel and when actions must wait until other have finished. UML has the simpler notion of fork/join, but PSS extends this to define if the two tasks must both start at the point of the fork (parallel), or if they can start at any time after the fork point (schedule). Actions may also be delayed based on the availability of resources, such as memory, or a DMA channel, or any specific resource that is constrained. A static analysis of the graph will yield these dependencies. A scheduler can then generate one or more sequences of all of the actions necessary to complete a given scenario. At Breker, we call the visual representation of this a “test map” that our tool generates and it shows you when each task is scheduled to run on each of the available resources. An example is shown in Fig 1. The arrows are showing the dependencies between the tasks.
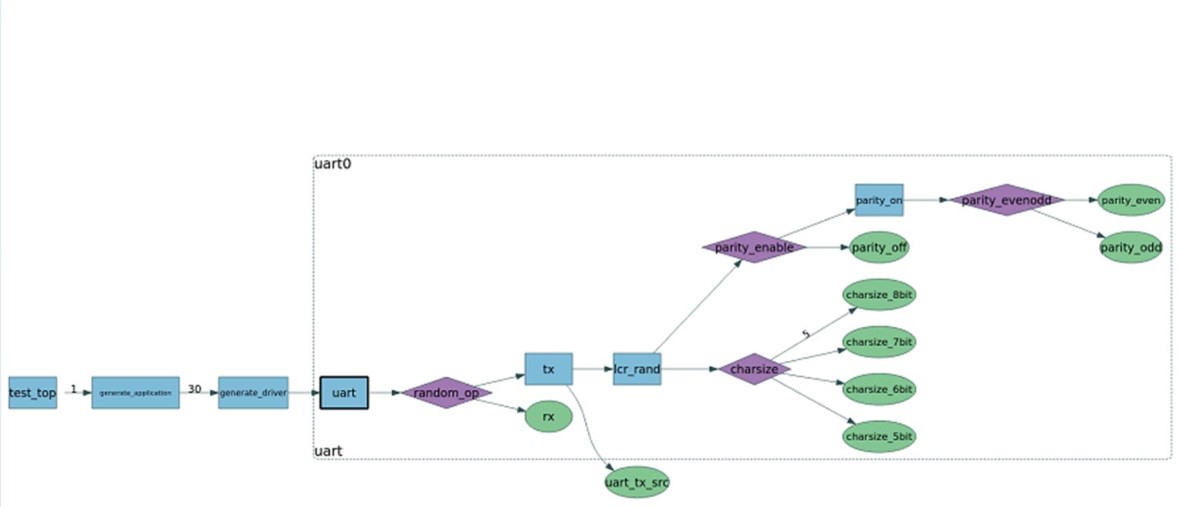
Fig 1. Test Map showing two processors each capable or running two threads The other major capability inherited from UML is the select construct. PSS adds to this the notion that the select can be random rather than be based on the value of a variable. This is used for making decisions and that enables randomization. Figure 2 shows part of a UART model. The visual representation is created automatically by the Breker tool from the model. The decisions can be seen as purple diamonds. For example, the UART can operate with parity turned on or off. If turned on, a further decision needs to be taken for which kind of parity, odd or even. When a test is created, these choices will be selected based on the goal of the test and constraints applied to the model.
Fig 2. Graphical representation of dependencies in a UART model The select is very different than the one you would encounter in a flow chart. In the flow chart, it is something that is evaluated at runtime and provides control flow within the model. In PSS, it may either be determined statically by a tool when creating a test, or it may be deferred and determined dynamically during execution of the test. In the former case, the generated test no longer contains the control statement, instead the outcome of the test has been determined by the tool and embedded into the test. In the latter case, those control statements remain and are evaluated when the test is executed. Some other extensions to basic graphs are the abilities to define looping, probabilities and both combinatorial and sequential constraints. It has also been found that for the generation of complex scenarios, it becomes necessary to embed procedural code into graph nodes that can invoke other nodes. The DSL currently has no notion of this, but is a fundamental capability of C++. The next time someone starts talking about PSS graph models, you should now know a little more about what they are talking about. If you start to suspect that they are talking about the ‘graphical’ representation of the model – call them on it. Breker has been working with customers for over a decade and has a good understanding of what needs to be in a model for the generation of complex self-checking testcases. We have demonstrated how to generate tests for simulation, emulation and actual silicon and have managed to help people solve some tough verification challenges. Portable Stimulus is still trying to catch up with much of that understanding, and at Breker we are very grateful to all of the support we are getting from the user community in the committee. Together we can do this. Tags: Breker, C++, DSL, graph-based, graphical representation, Petri nets, Portable Stimulus Standard, PSS, test map, TutorialsPoint, UART, UML Activity Diagrams, visual Category: Knowledge Depot 2 Responses to “Understanding Portable Stimulus Graphs”Warning: Undefined variable $user_ID in /www/www10/htdocs/blogs/wp-content/themes/ibs_default/comments.php on line 83 You must be logged in to post a comment. |
|
|
|||||
|
|
|||||
|
|||||


 Animation, 3D Art and 3D Models")
Adnan,
In your article, you mention “The next time someone starts talking about PSS graph models, you should now know a little more about what they are talking about.” But I’m not sure you are helping in that. You rightly mention UML activity concepts, as being close to PSS – actions, attributes and constraints, data inputs and outputs, resource dependencies, forks/joins, loops. But the diagrams you show seem to be completely unrelated to PSS . If you really want your readers to know a little more about PSS models, it would be good to show PSS examples along with the graphical representation of PSS, not of something which appears to be unrelated to PSS (or if I misunderstand how these graph diagrams you show relate to PSS, can you explain how they map to the semantics and concepts of PSS?).
Sharon Rosenberg, Cadence Design Systems
Sharon, thank you for your comment. We have observed, over the nine or so years working with end-users on portable stimulus related development, that these visualizations are the most intuitive and helpful in explaining PSS core concepts. Of course, as you may remember from your committee activities, the standard does not specify a visual representation but it is clear to us that the better tools will provide such a view. A PSS activity defines a graph of possible operations and therefore it would seem that a graph-based visual representation makes the most sense. After all, there is a reason that the original keyword for the “activity” was actually “graph.” The diagram we show is one automatically generated from the input description that shows the possible paths from which our scenario generator can choose. It is up to the various vendors in this space to generate the visualizations they feel make the most sense to them. The market will ultimately demonstrate which representations are useful. -adnan