


EDACafe Editorial Roberto Frazzoli
Roberto Frazzoli is a contributing editor to EDACafe. His interests as a technology journalist focus on the semiconductor ecosystem in all its aspects. Roberto started covering electronics in 1987. His weekly contribution to EDACafe started in early 2019. Cadence tackles verification productivity with AI-based VerisiumSeptember 30th, 2022 by Roberto Frazzoli
A closer look at the new platform – currently focused on debugging – with the help of Cadence’s Matt Graham With ever-growing device size and complexity, SoC verification has become an extremely challenging task, often requiring more compute time and qualified human resources than any other step in the engineering flow. According to a Cadence estimate, the verification effort can often climb to more than 500 years of compute time – with tens of millions of runs and hundreds of millions of coverage bins, to uncover thousands of bugs. Debugging alone can consume multiple weeks of time of many engineers. In terms of time-to-market, therefore, verification can be considered a key limiting factor and a potential cause of schedule slips. Reconciling a thorough verification coverage with a tight SoC development schedule clearly calls for better productivity through automation, an even more challenging goal. A new approach to improving verification productivity is now proposed by Cadence with its Verisium Artificial Intelligence-Driven Verification Platform – a suite of applications leveraging big data and AI to optimize verification workloads, boost coverage and accelerate root cause analysis of bugs. The Verisium platform is built on the new Cadence Joint Enterprise Data and AI (JedAI) Platform and is natively integrated with the Cadence verification engines. The initial suite of apps available in the Verisium platform is focused on debugging, a very significant part of verification. Matt Graham, group director at Cadence Design Systems, described the Verisium apps in the video interview he recently gave to EDACafe’s Sanjay Gangal; in this article we will summarize his answers and add a few details, as well as the responses he provided to some additional questions.
Saving engineering time through better use of existing EDA data A key concept behind Verisium is that the big amount of heterogenous EDA data generated during the development process of one or multiple SoCs – largely underused until now – can be better exploited to help verification engineers. One of the reasons why verification is such an overwhelming task is that manual analysis tends to consider one tool run at a time or one EDA engine at a time, depriving the engineers of hints that could be inferred by comparing multiple runs or multiple engines. If no information is available to help shortlisting the root cause suspects, there’s no choice but considering all candidates in some sort of a brute force approach. But that information is actually available, hidden in the EDA data that have already been generated, and can be ‘mined’ by comparing multiple runs from a certain tool, or the results from multiple tools. This is what Cadence calls a “multi-run, multi-engine” approach, enabled by big data and AI. According to Cadence this is a generational shift in EDA, from single-run, single-engine algorithms. In the examples used by Graham, this means “leveraging data from simulations yesterday or last week to improve the efficiency of debugging failures from today, or improving the effectiveness of the simulations tomorrow. Similarly, leveraging data from Jasper formal runs to help debug Xcelium simulation failures.” Introducing some automation also helps improve verification coverage, as Graham observed: “Some of the analysis we’re automating with Verisium is already done manually, but with limited scope due to lack of time, or lack of capacity of a human engineer: e.g. an engineer comparing behavior across thousands of signals in simulation isn’t really feasible.” The role of big data and machine learning In Verisium, big data analysis can be considered the enabling technology that makes the multi-run, multi-engine approach possible. The JedAI platform ingests all the verification data generated during the SoC development flow – including waveforms, coverage, reports and log files – making results from multiple runs and multiple engines available for analysis. Then machine learning and other proprietary metrics are used to automate the recognition of patterns that link a certain set of data to another one. “Verisium learns from a multitude of sources,” Graham explained. “It connects to the revision control system to learn patterns of who is checking-in what and when, and which check-ins are most likely to cause a failure or bug. It also looks at which failing tests may be related to each other. The data it considers is a combination of design and testbench data, as well as data from the surrounding infrastructure (e.g. revision control, file system, compute farm, etc.). Verisium can learn from the current design, or have a ‘warm start’, so to speak, and learn from previous designs.” A ‘driver assistance’ system for verification engineers – focused on debugging Verisium helps verification engineers by automating specific subtasks, such as shortlisting the suspect causes of a certain bug. Help takes the form of a “driver assistance”, as Graham called it borrowing terms from the automotive jargon: “We’re not looking for full self-driving, we’re looking for [functions] like adaptive cruise control or lane keeping,” he said. The initial release of Verisium is focused on debugging, which can take up to 44% of ASIC verification time, according to a study from Wilson Research Group/Mentor. The suite currently includes six apps: AutoTriage, SemanticDiff, WaveMiner, PinDown, Debug, and Manager. Let’s take a look at each of them. 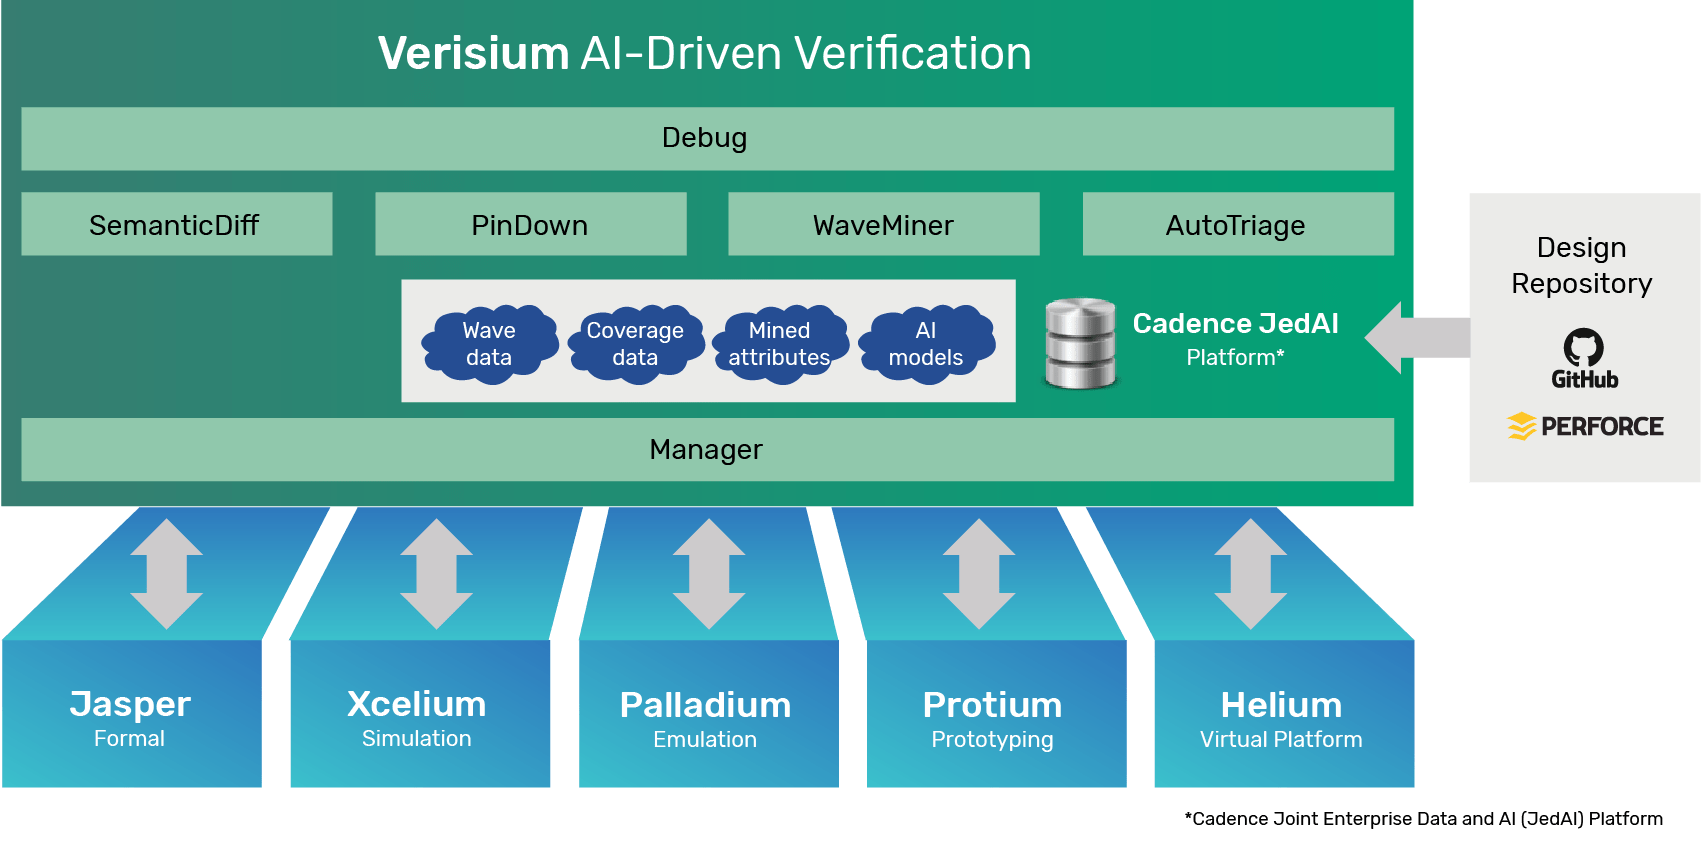 Credit: Cadence Verisium AutoTriage Verisium AutoTriage builds ML models that help automate the repetitive task of regression failure triage by predicting and classifying test failures with common root causes. As Graham put it, AutoTriage positively answers this question: “Can we automate what is effectively a manual process by gathering data not just from simulation or just from emulation, but across multiple of those engines and then help to automate certain processes in the verification flow? (…) AutoTriage – he continued – aims to mine data out of your regression data sources, like log files or what’s happening in the farm or other things that are going on in your environment, to help you categorize the failing tests. Let’s say you ran thousands of simulations as part of a regression. If 500 of them fail, you don’t have 500 unique bugs; you have a few unique bugs, and each one of them is showing up in multiple different tests. AutoTriage is trying to help you look for where you have tests that are all failing for the same underlying bug. And not just using simple things like the failure message: can we add some natural language processing? Can we look at other things – like what host did it run on, who wrote the test, what time did the test run – to generate a machine learning model? [This enables to] automatically bucketize those tests failures by the underlying root cause.” Verisium SemanticDiff Verisium SemanticDiff provides an algorithmic solution to compare multiple source code revisions of an IP or SoC, classify these revisions and rank which updates are most disruptive to the system’s behavior, to help pinpoint potential bug hotspots. “SemanticDiff looks at code changes,” Graham explained. “When you’ve made a change to the RTL of a device, for example: what is the actual behavioral change that code has caused? The simplest example is: I checked-in a bunch of changes to RTL files but they were just comments. Clearly, that’s not going to introduce a bug because they’re just comments. But can I look at all the code changes that I’ve made and rank them [to highlight] the ones that are the most disruptive? For example, I changed an entire case statement or entire state machine: that’s going to be pretty disruptive. If I only change a variable name or something like that, that’s going to be less disruptive. That will help our AI engines understand where to look for changes, and it can help the engineers understand where to look for bugs and disruptiveness in general in the environment as you go through your development process,” he said. Verisium WaveMiner Verisium WaveMiner applies AI engines to analyze waveforms from multiple runs and determine which signals, at which times, are most likely to represent the root cause of a test failure. “WaveMiner takes as input two or more waveform files,” Graham explained, “and then does some sort of pattern-based AI type algorithms, leveraging some of our technology in the Jasper formal tool, to identify where the behavior might diverge between two waveforms. For example, if you had one waveform from a run of a test that passed, and another waveform from a run of a similar or same test that failed. The goal of WaveMiner – Graham continued – is to look where those behaviors diverge, and then pinpoint them to individual signals at individual times, to highlight what would be the root cause of that behavior diverging. (…) You go from maybe hundreds or even thousands of failures down to a couple of waveforms that can then help you pinpoint where the specific failure might be.” The three apps mentioned above can be used individually, or can form an AI-driven flow – as opposed to the manual flow – as described in this image: 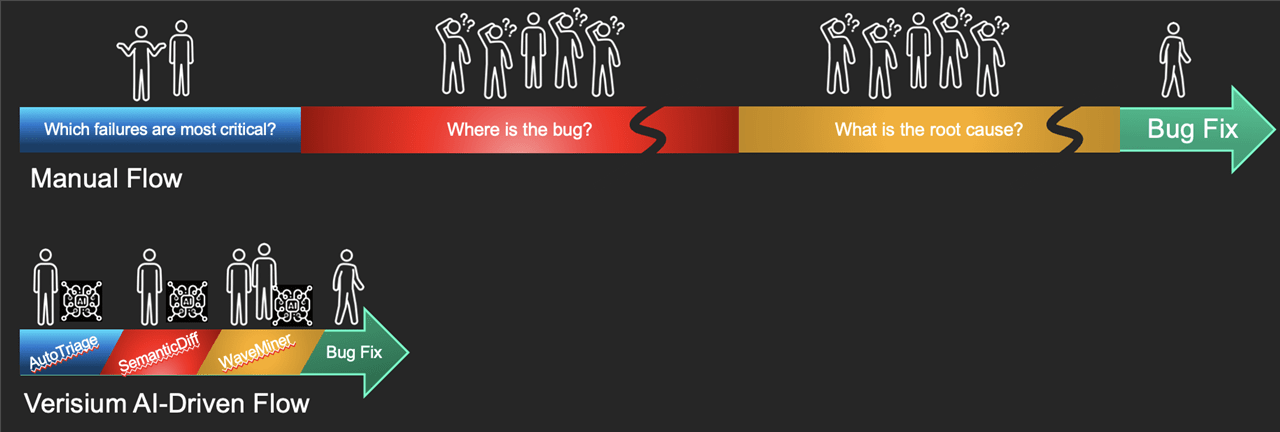 Credit: Cadence Verisium PinDown Verisium PinDown integrates with the Cadence JedAI Platform and industry-standard revision control systems to build ML models of source code changes, test reports and log files to predict which source code check-ins are most likely to have introduced failures. Graham provided an example: “You ran a regression last week and another one this week, and you’ve made some changes to the design and the testbench in the ensuing time period. You’ve checked-in dozens or maybe hundreds of changes. PinDown looks at a failing test and tries to go back through the history of your revision control until it finds the point where that test starts to pass again. It wants to find the point in time when it went from passing to failing. And once it does that, it can then validate what exactly the check-in was around that tipping point that caused the test to go from passing to failing. PinDown – he continued – highlights up to the user: here’s a particular piece of code or multiple pieces of codes that you checked-in that caused the behavior to change in your testbench. Inside PinDown we have some machine learning models and some other pattern-based AI, so we’re not just going serially back through the history of your check-ins; we’re trying to highlight where the hotspots might be, where bugs might exist and start trying those points to find the tipping points to get a little more efficiency out of it,” Graham pointed out. Verisium Debug Cadence describes Verisium Debug as “a holistic debug solution” from IP to SoC and from single-run to multi-run, offering interactive and post-process debug flows with waveform, schematic, driver tracing and SmartLog technologies. Verisium Debug is natively integrated with the Cadence JedAI Platform and the other Verisium apps to enable AI-driven root cause analysis with the support of simultaneous automatic comparison of passing and failing tests. “Verisium Debug is our next generation debug app,” Graham commented. “It’s the waveform viewer, schematic viewer, source browser etc. And that’s the front end of a lot of those applications that I discussed. For example, the output of WaveMiner and SemanticDiff are shown up in Verisium Debug. One of the things we’ve added to Verisium Debug is the ability to do this kind of ‘side-by-side’ or ‘multi-run’ debug. For example, if you’re debugging up a passing versus failing, like a regression failure type of situation, Verisium Debug allows you to bring up not only the passing waveform, but also the passing snapshot, the passing source code, etc., and then the failing source code, waveform, snapshot etc.. It then allows you to compare them, and show the hints from WaveMiner and SemanticDiff to help you narrow down to that bug, to pinpoint the root cause,” he said. 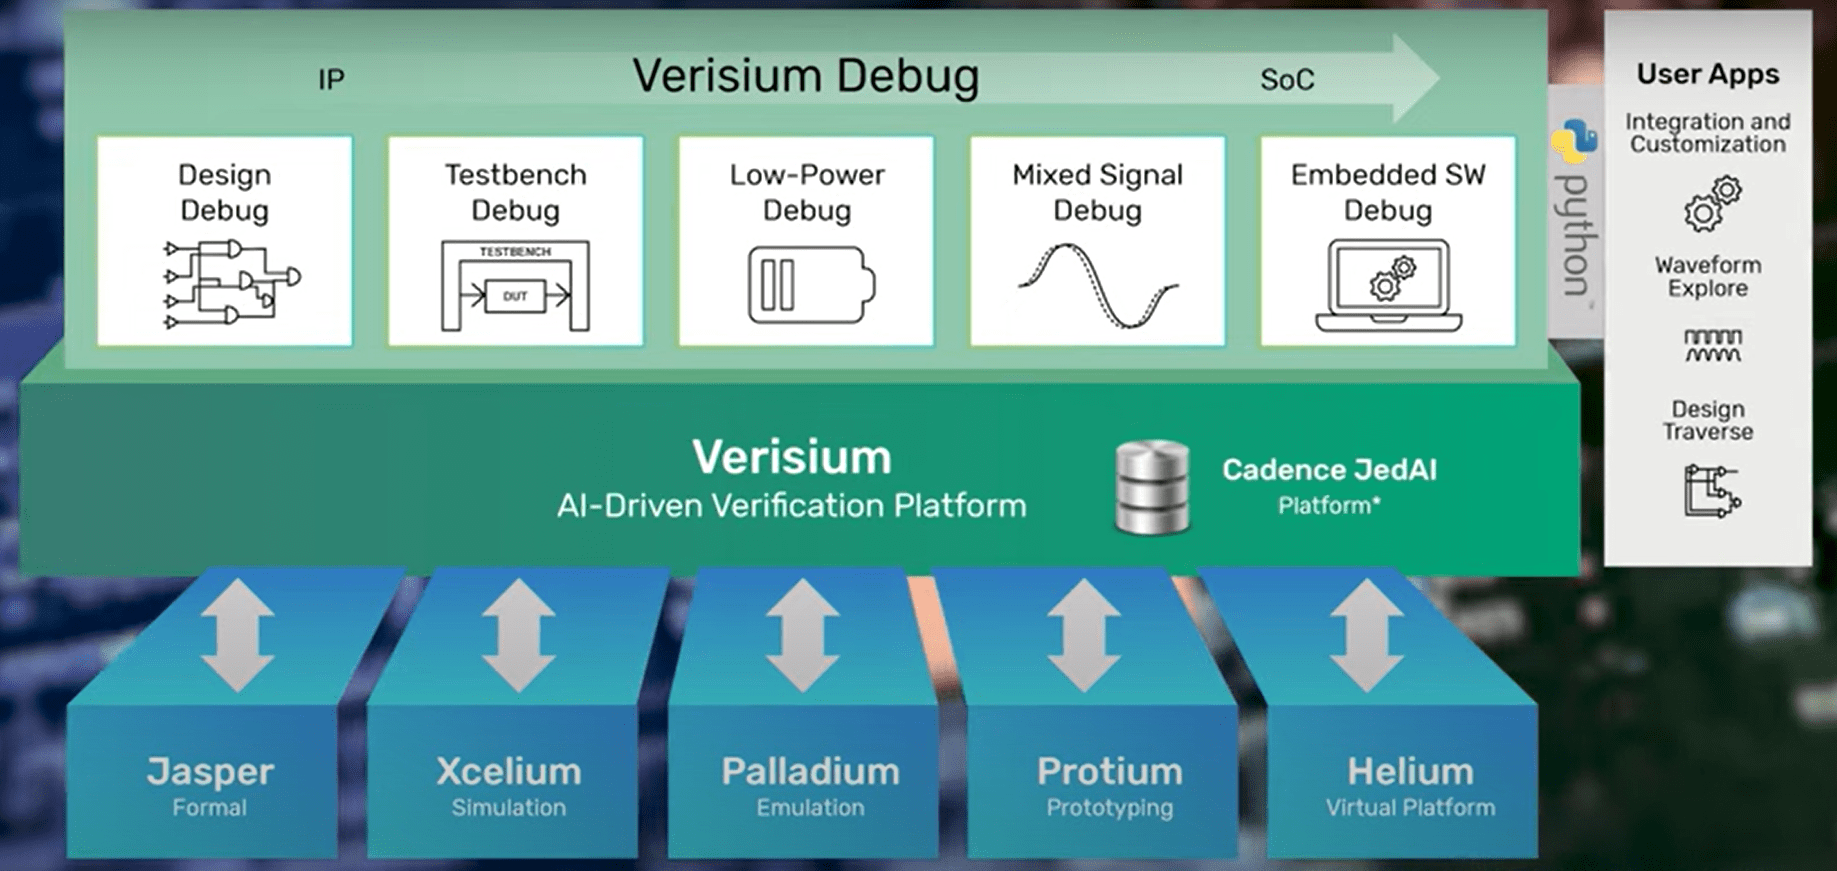 Credit: Cadence As debug is the main focus of this initial Verisium release, it’s worth taking a look at some details concerning Verisium Debug. As for testbench debug, the app – natively integrated with Xcelium Logic Simulator – provides interactive and post-process UVM SystemVerilog and Specman Elite/e-aware debug with constraint debugging, access to dynamic constructs, randomization process, etc. As for RTL and gate-level debug, it provides driver tracing, waveform viewer, design hierarchy navigation, detailed schematic, and SmartLog technology. Emulation and prototyping debug leverages the native integration with the Palladium emulation and Protium prototyping platforms, to deliver – according to Cadence – fast massively parallel multi-billion-gate capacity waveform dump and post-process debug. Other features include, for mixed-signals, waveform, source code, and simulation control of nets and real number model-based SystemVerilog; interactive post-process debug of low-power simulations with IEEE 1801/UPF and X-propagation, including waveform, source, schematic etc.; and embedded software debug functions, such as simultaneous synchronized debug of RTL and embedded software, through native integration with the Helium Virtual and Hybrid Studio. Verisium Debug provides a Python API interface to allow users to develop custom apps for functions, widgets, and flow integrations. The Verisium Waveform Database (VWDB) uses a new architecture for recording and accessing probed data, achieving – according to Cadence – orders of magnitude faster response time. 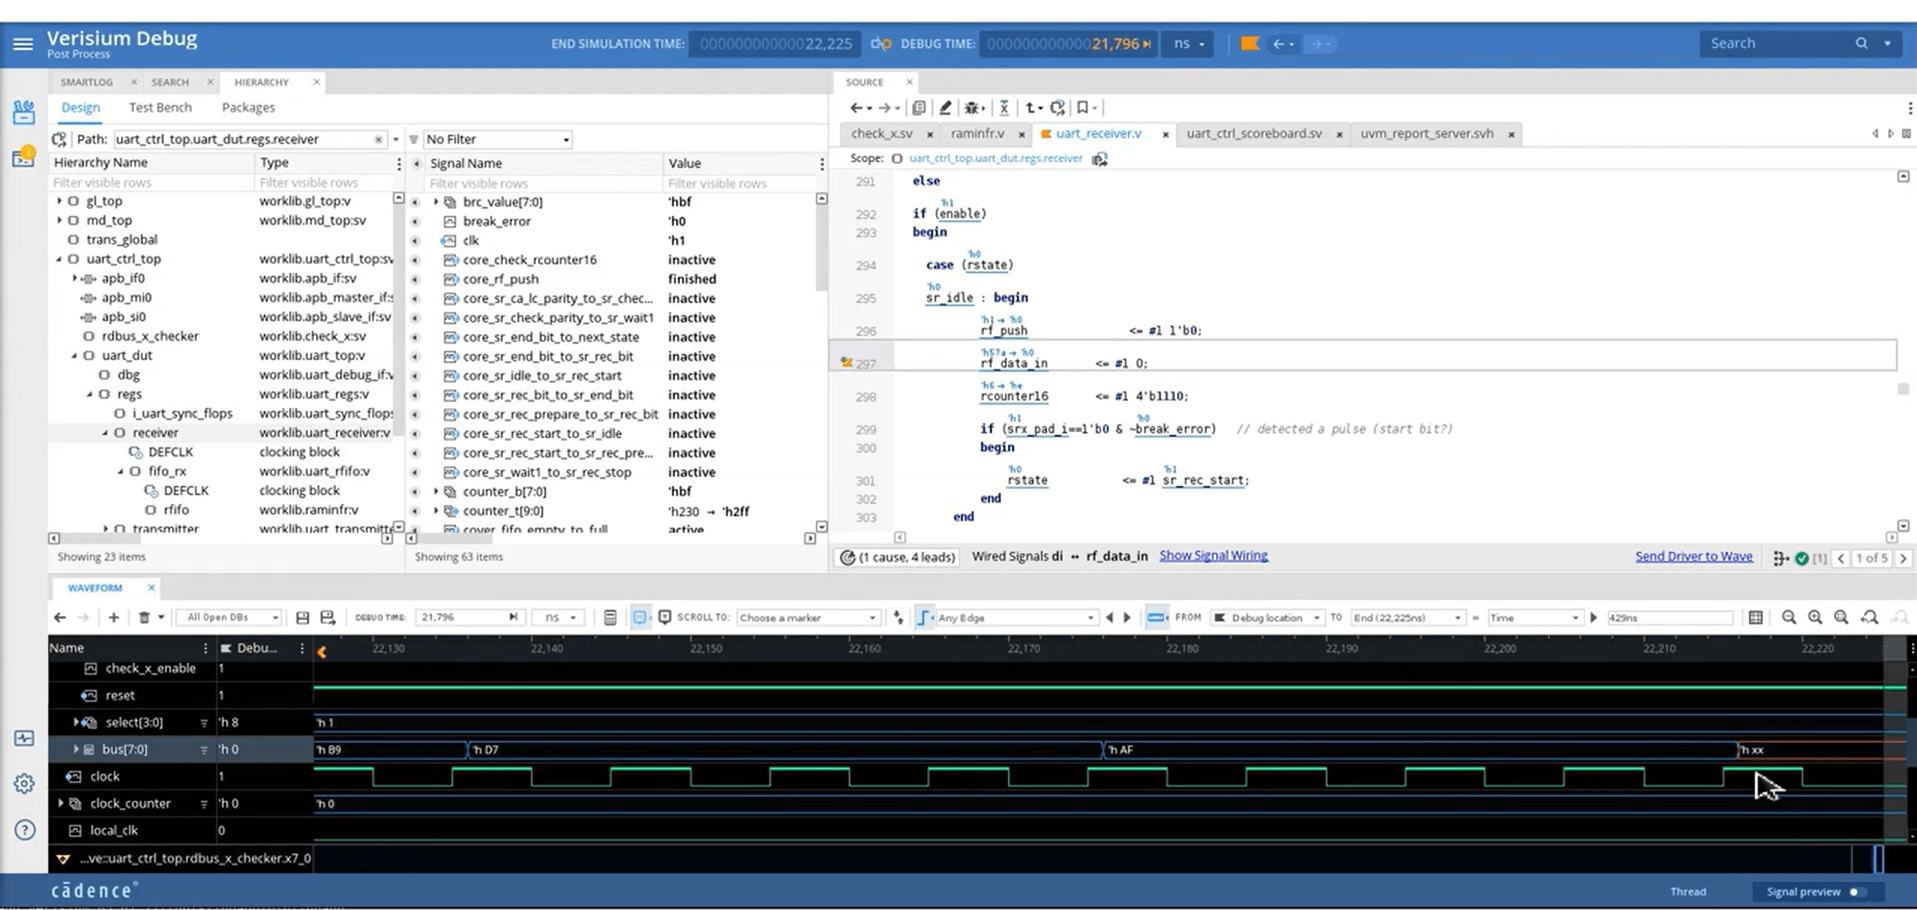 A Verisium Debug screenshot. Credit: Cadence Verisium Manager The Verisium Manager app already existed before the introduction of the Verisium suite; it used to be called ‘V Manager’. It’s Cadence’s full flow IP and SoC-level verification management solution with verification planning, job scheduling, and multi-engine coverage – now natively integrated with the Cadence JedAI Platform – and supports AI-driven testsuite optimization to improve compute farm efficiency. Verisium Manager also integrates directly with the other Verisium apps, enabling – according to Cadence – interactive pushbutton deployment of the complete Verisium platform from a unified browser-based management console. “Verisium Manager forms some of the basis of the multi-run capability of the Verisium platform, “Graham said. “For example, the PinDown app, that’s looking at re-running jobs and understanding what passed and failed, leverages Verisium Manager as the front end.” 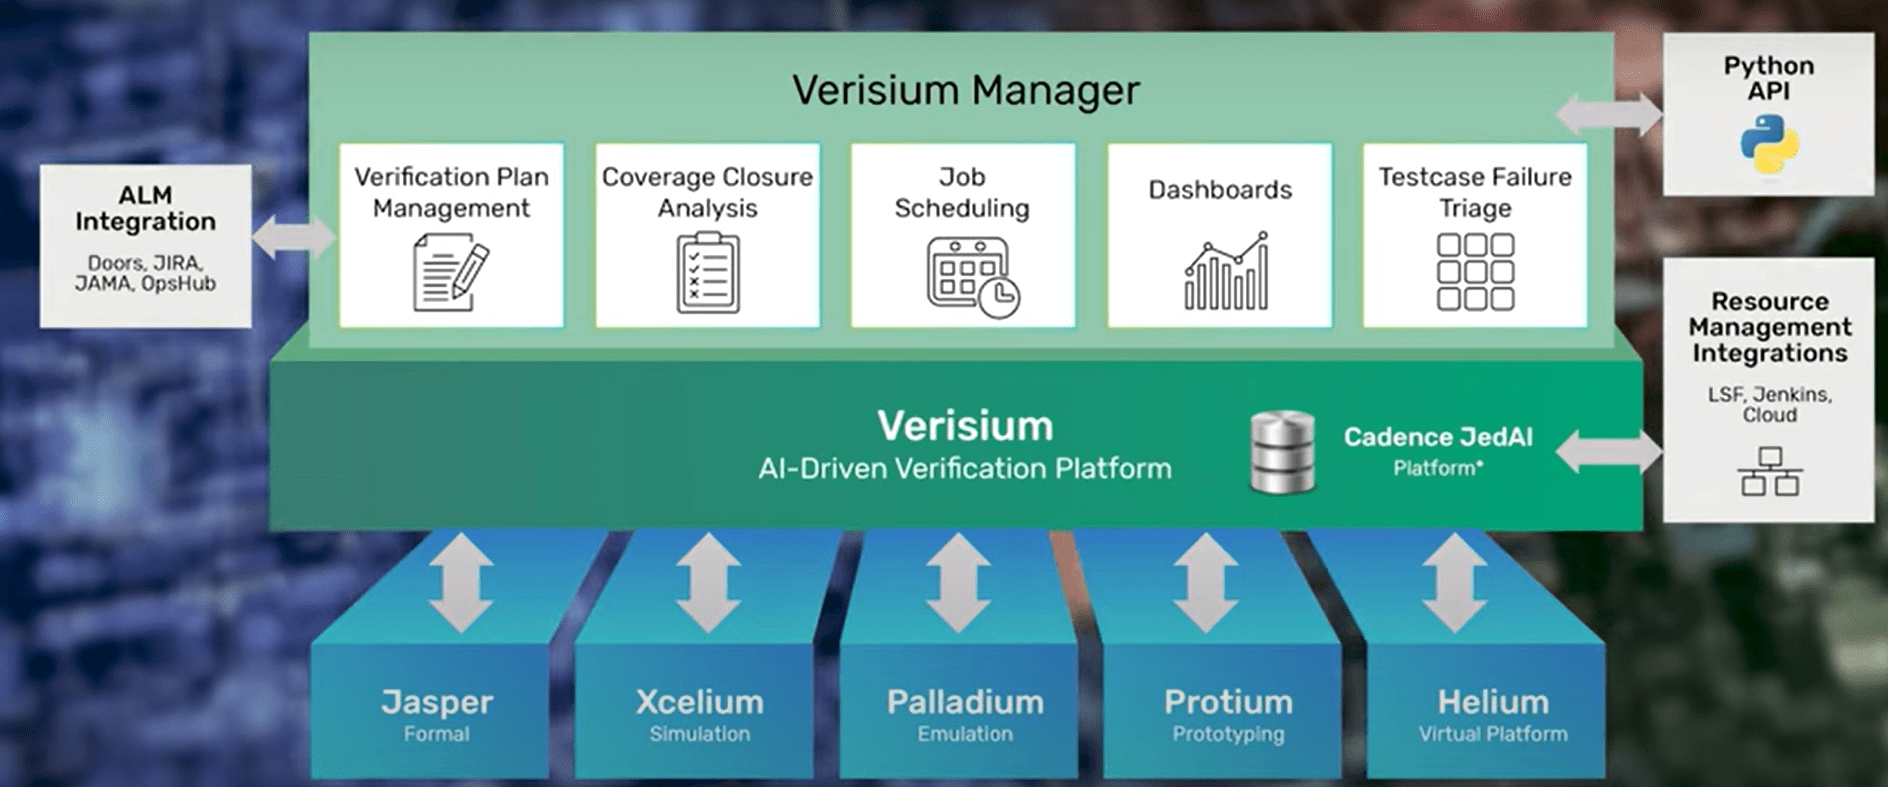 Credit: Cadence Delving deeper into some of the Verisium Manager details, multi-engine verification planning leverages the connections to specifications, requirements management tools (such as Jama, JIRA, and Doors), and native integration with coverage metrics generated by Cadence’s Xcelium, Jasper, Palladium, and Protium platforms. A portfolio of Python APIs enables direct access to the Verisium Manager data, metrics, and flows to enable customized data mining and test suite automation flows. As for job scheduling and execution, Verisium Manager connects with resource management and continuous integration tools such as LSF, Altair Accelerator, and Jenkins, as well as in-rack hardware job management engines on the Palladium and Protium platforms to increase the levels of compute farm utilization. Verisium Manager also provides a set of features and utilities for driving coverage closure, from fine-grained, bin-level coverage refinement through management-level dashboards and reporting. A browser-based management console provides regression data reporting and aggregation from management-level dashboards through fine-grained technical analysis. How Verisium fits into the Cadence offering The Verisium AI-Driven Verification Platform is part of the Cadence verification full flow, which includes Palladium Z2 emulation, Protium X2 prototyping, Xcelium simulation, the Jasper Formal Verification Platform and the Helium Virtual and Hybrid Studio. “Those are the workhorses,” Graham commented, “they’re gonna be doing what they do in generating data. Verisium is gonna sit on top of all of those and gather up all the data that’s generated.” As an AI-driven platform, Verisium leverages the Cadence JedAI Platform – just as Cadence Cerebrus Intelligent Chip Explorer and Optimality Intelligent System Explorer. “All those AI applications need a lot of data,” Graham observed, “and if you have a lot of data, you need the ability to store it and catalog it. JedAI is this kind of underlying platform that gives us the functionality of storing and cataloging all that data, waveforms coverage log files, etc. (…) JedAI gives us that platform to be able to store that data and catalog it and retrieve it, and also gives us some base AI functionality as well.” As Graham pointed out, in the future the JedAI platform could be leveraged to create more multi-run, multi-engine apps, such as – for example – to improve simulation by leveraging synthesis output. 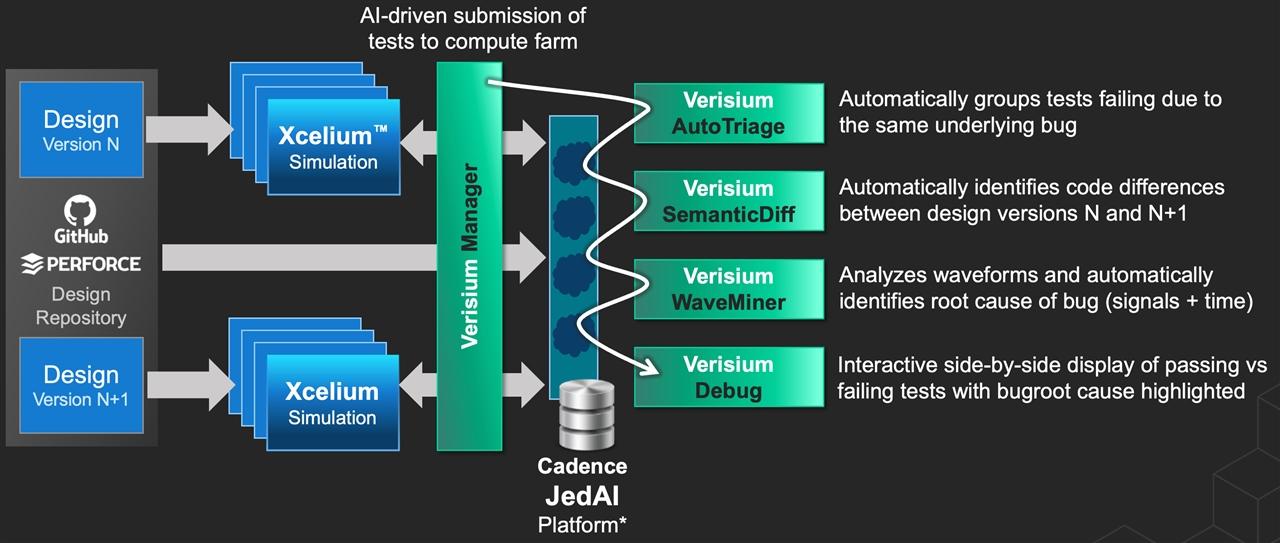 Credit: Cadence Early user reactions Verisium is already being used by some Cadence’s customers. “We’ve really worked hard with some of our partners – Graham confirmed – to not just come up with technology that is science experiment, but to really apply it. (…) We have a big long roadmap in our vision, but the stuff that we talked about, the WaveMiner, the PinDown, that’s in use today with those customers that were part of our announcement,” he said referring to the endorsements provided by MediaTek, Samsung Electronics, and STMicroelectronics. “The rubber has met the road with a number of these things, and we already see it providing value and really improving productivity for our customers’ engineers,” Graham concluded. Additional information about Verisium More details about Verisium can obviously be accessed from the relevant page on the Cadence website, Resources include videos with Ziyad Hanna, Corporate Vice President of R&D at Cadence, providing a general introduction of the platform; with Matt Graham, introducing Verisium Manager; with Moshik Rubin, Product Management Sr. Group Director at Cadence, introducing Verisium Debug; and with Izhar Melnikovsky, Debug Solution Engineer at Cadence, providing additional details on Verisium Debug. As for the JedAI platform, Cadence has produced a white paper – describing, among other things, the diversity of EDA data it can ingest – and this blog post from Venkat Thanvantri. Categories: EDACafe Editorial, Video Interview |
|
|
|||||
|
|
|||||
|
|||||


 Animation, 3D Art and 3D Models")