


Bridging the Frontier Paul Cohen
Paul Cohen is senior manager, ESD Alliance at SEMI. Electronic System Design Reports 15% Q3 Revenue Growth; IP, Asia Pacific Surpass $1BJanuary 11th, 2021 by Paul Cohen
In the middle of the pandemic, I’m pleased to share good news about the electronic system design ecosystem! Revenue for our part of the semiconductor industry increased 15% in Q3 2020 to $2,953.9 million, compared to $2,567.7 million in Q3 2019. All categories, both product and regional, logged significant gains, according to the ESD Alliance Market Statistics Service (MSS), the quintessential report on EDA, IP and services industry revenue data available quarterly to member companies.
Revenue for the electronic system design ecosystem increased 15% in Q3 2020 to $2,953.9 million, compared to $2,567.7 million in Q3 2019. Computer Aided Engineering (CAE), semiconductor IP and services categories and, regionally, the Americas, Europe, Middle East and Africa and Asia Pacific reported double-digit growth. The semiconductor IP category and the Asia Pacific region both surpassed $1 billion in quarterly revenue. Public and private companies contribute to data and employed 47,087 people in Q3 2020, a 4.8% increase over the Q3 2019 headcount of 44,950 and up 1.1% compared to Q2 2020.
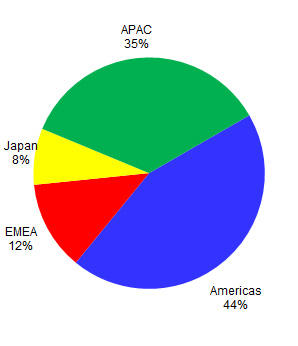
All told, the four-quarter moving average comparing the most recent four quarters to the prior four quarters rose by 8.3%. A closer look at revenue by product category reveals that CAE revenue increased 10.7% to $927.6 million compared to Q3 2019 and its four-quarter moving average increased 7.2%. IC Physical Design and Verification revenue increased 9.1% to $608.2 million compared to Q3 2019 with a four-quarter moving average that rose 3.2%. Printed Circuit Board and Multi-Chip Module (PCB and MCM) revenue increased 8.3% to $260.4 million compared to Q3 2019. Its four-quarter moving average increased 9.8%. Semiconductor IP revenue increased 25.8% to $1,051.7 million compared to Q3 2019, as the four-quarter moving average grew 13.9%. Finally, services revenue increased 11% to $105.9 million compared to Q3 2019, though the four-quarter moving average for services decreased 6.7%. Moving on to revenue by region, the Americas, the largest reporting region by revenue, purchased $1,307.2 million of EDA products and services in Q3 2020, an 11.7% increase compared to Q3 2019. The four-quarter moving average increased 5.1%. Europe, the Middle East and Africa (EMEA) revenue increased 4.9%, to $368.3 million compared to Q3 2019 for a four-quarter moving average that grew 13.4%. Japan revenue increased 6% to $232.4 million compared to Q3 2019. Its four-quarter moving average rose 4.7%. Asia Pacific (APAC) revenue increased 26.4% to $1,046 million compared to Q3 2019 and the four-quarter moving average increased 11.3%. The MSS Report is considered the most valued report in the design industry for strategic planning and market analysis. We invite you and your company to join the ESD Alliance to make a positive impact on the industry, as well as your company and your career, and be part of the organization driving the design ecosystem forward. The ESD Alliance is a SEMI Strategic Technology Community. Companies can join SEMI and apply to become a member of the ESD Alliance at no extra cost. To learn more about the ESD Alliance and our other programs and initiatives, visit the ESD Alliance website or contact me at pcohen@semi.org. Engage with the ESD Alliance at: Website: www.esd-alliance.org ESD Alliance Bridging the Frontier blog Twitter: @ESDAlliance |
|
|
|||||
|
|
|||||
|
|||||


 Animation, 3D Art and 3D Models")