The Breker Trekker Tom Anderson, VP of Marketing
Tom Anderson is vice president of Marketing for Breker Verification Systems. He previously served as Product Management Group Director for Advanced Verification Solutions at Cadence, Technical Marketing Director in the Verification Group at Synopsys and Vice President of Applications Engineering at … More » A Guide to Composition for Graph-Based Scenario ModelsJuly 22nd, 2014 by Tom Anderson, VP of Marketing
In our last post, we went into quite a detailed discussion of how the Accellera Universal Verification Methodology (UVM) has limitations on reuse. Specifically, we showed why it is not possible to compose scoreboards and virtual sequencers together as you move up the design hierarchy from verifying blocks to verifying clusters or complete chips. In the process, information about how connected blocks communicate is lost and must be recreated in the higher-level sequencer. We also claimed that graph-based scenario models provide more effective reuse, specifically because lower-level graphs can be composed into a higher-level graph as blocks are combined and you move up the chip hierarchy vertically. Block-level graphs compose cluster-level graphs, and cluster-level graphs compose full-chip graphs. In today’s post, we take the same example used last time and show how reuse works with graph-based scenario models rather than pure UVM testbenches.
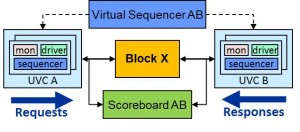
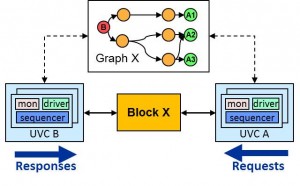
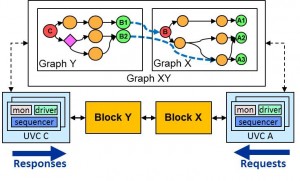
This figure on the left is taken from the previous post, showing how the various elements of a standard UVM testbench connect to the design being verified. When scenario models are used to generate transaction test cases, they tie directly to existing UVM verification components (UVCs) in the testbench, as shown on the right. Note that, in accordance with our “begin with the end in mind” methodology, the data flow and graph are drawn with the outputs on the left and the inputs on the right. The graph can generate a simulation run-time element that uses the UVC transactional interfaces to drive stimulus to the design inputs and to collect results from the design outputs. This element also checks the results so that all generated test cases are fully self-checking. Note that this run-time element completely replaces the virtual sequencer and scoreboard: you do not have to write either! The verification team invests a relatively small amount of effort into specifying the graph, and in return all test cases and a major portion of the testbench are generated entirely automatically. The return-on-investment (ROI) for scenario models is even higher when vertical reuse is taken into account. Unlike virtual sequencers and scoreboards, graphs are composable when moving from lower to higher levels of the design. Imagine that a second block, Y, has also been verified using a scenario model, and that these two blocks are connected together at higher levels of the hierarchy. Plugging the graph-based scenario models together is as easy as plugging the design blocks together, perhaps even easier: The composite graph XY is created by simply instantiating and connecting graphs X and Y. The new graph can generate a new run-time element and new test cases for the combined design (X and Y). You do not have to write either a new virtual sequencer or a new scoreboard for the combined testbench. This ROI continues to grow as the verification team moves up the design hierarchy from blocks to small clusters to large clusters to complete chips. At every stage, subgraphs are composed into higher-level graphs. Graph constraints and generation options can be used to fine-tune the test cases for each level. Perhaps the biggest advantage of using graphs rather than traditional UVM testbenches is that no “knowledge” is lost when the scenario models are composed. In this example, graph X “knows” that it must generate a test case with the sequence { B1, B2 } in order to produce result C. Graph Y “knows” that it must generate the sequence { A1, A2, A3 } to make B happen. When the graphs are combined, the test case generator simply traces through the combined graph to determine that { A1, A2, A3 } is needed to yield result C. As we discussed in our last post, there is no way to combine virtual sequencers to retain this sort of interconnected knowledge. We believe that graph-based scenario models are the right technology to move the industry beyond the UVM and satisfy the goals of the Accellera Portable Stimulus Proposed Working Group. They provide better vertical reuse, eliminate a great deal of testbench hand-coding, and preserve critical verification knowledge when portions of the design are combined into clusters or chips. Do you agree? Disagree? We would love to hear comments from you. Tom A. The truth is out there … sometimes it’s in a blog. Tags: Accellera, Breker, coverage, EDA, functional verification, graph, portable stimulus, pwg, reuse, scenario model, scoreboard, sequencer, SoC verification, standards, UVC, uvm, working group 2 Responses to “A Guide to Composition for Graph-Based Scenario Models”Warning: Undefined variable $user_ID in /www/www10/htdocs/blogs/wp-content/themes/ibs_default/comments.php on line 83 You must be logged in to post a comment. |
|
|
|||||
|
|
|||||
|
|||||


I would be very interested to find out more about the checking part of the simulation run-time element. Is there a whitepaper on this?
Tudor,
We do not have a whitepaper specific to results checking, but there is more information about how our run-time element TrekBox works in the “Products” section of the Breker site. I will schedule a new blog post on this topic in the near future. Thanks for your interest!
Tom A.