The Breker Trekker Tom Anderson, VP of Marketing
Tom Anderson is vice president of Marketing for Breker Verification Systems. He previously served as Product Management Group Director for Advanced Verification Solutions at Cadence, Technical Marketing Director in the Verification Group at Synopsys and Vice President of Applications Engineering at … More » Automated, Realistic Performance Analysis for Your SoCJune 22nd, 2016 by Tom Anderson, VP of Marketing
We have a saying here at Breker that the fundamental job of any EDA company in the functional verification space is to “find more bugs, more quickly.” A good verification solution increases design quality by finding more bugs, improves time to market by closing verification faster, or reduces project cost by requiring fewer resources. A great verification solution, which we strive to offer, does all three. Accordingly, we talk a lot about the type of design bugs we can find with less time and effort than traditional methods. We have another saying at Breker: “A performance shortfall is a functional bug.” A lot of people differentiate between these two cases, but we don’t agree. The specification for your SoC describes its performance goals as well as its functionality. Not meeting your requirements for latency or throughout can render your SoC unsellable just as surely as a broken feature. So we also talk a lot about how our portable stimulus techniques generate test cases for performance verification.
We have new technology to share in this post, but performance is not a new topic for Breker. Regular readers will recall that we have discussed our capabilities to thoroughly stress many aspects of your SoC design, including:
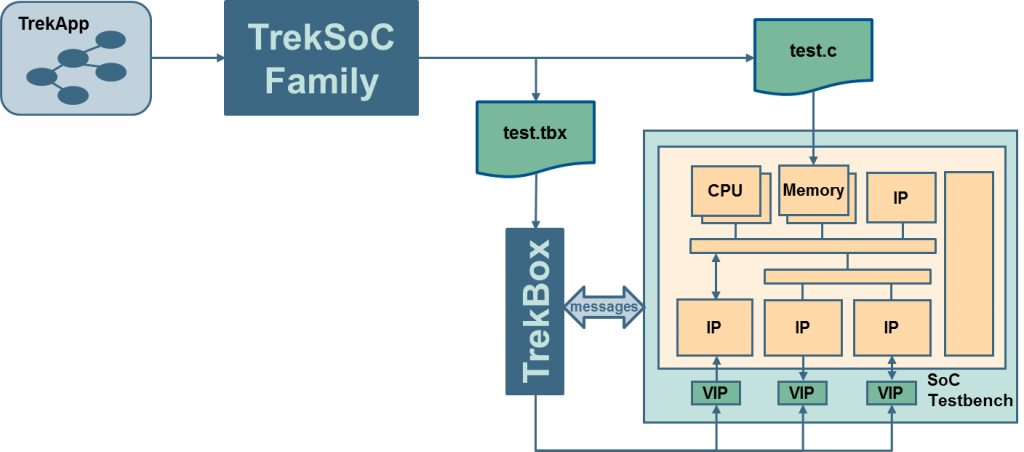
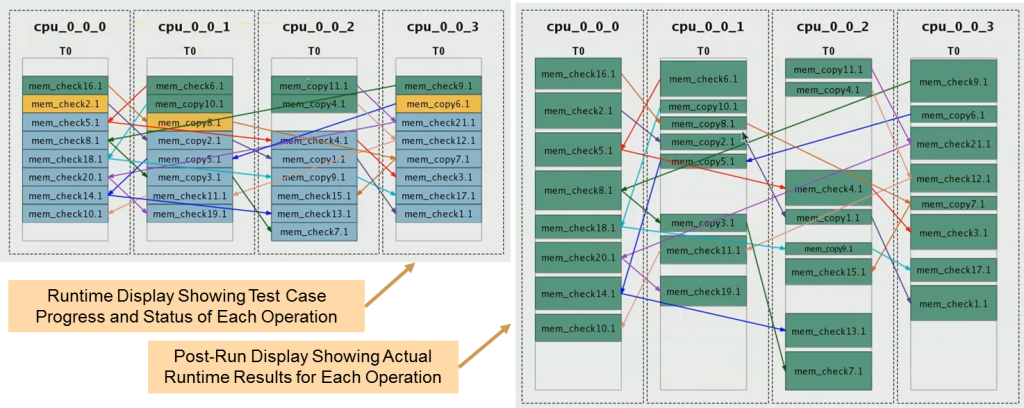
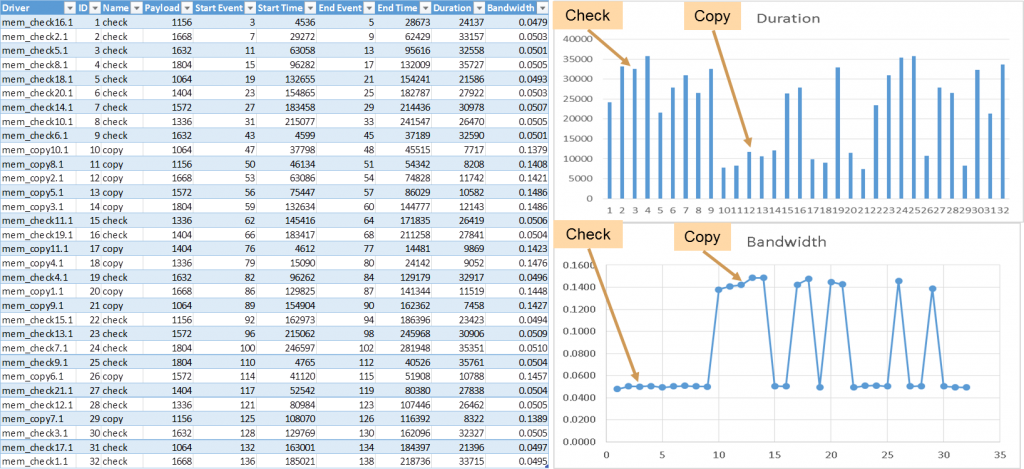
Regardless of which parts of your SoC you want to stress and which performance metrics you want to gather, our TrekSoC family is flexible enough to accommodate your needs. As a reminder, our solution generates both multi-threaded C programs that run in your SoC’s embedded processors and UVM transactions that interact with your existing testbench VIP components. As seen in the following diagram, the TrekBox runtime module coordinates the software-driven test cases and activity in the testbench. This setup provides great flexibility. An appropriate TrekApp application can automatically generate test cases designed to stress specific aspects of your design with minimal user input. For example, our Cache Coherency TrekApp generates test cases carefully crafted to hit corner cases in multi-level caches. If you want to extend this verification to exercise IP blocks at the same time, you can add a TrekApp for a specific I/O protocol or extend the graph-based scenario model to provide information about your custom IP. These particular test cases are unlikely to stress maximum performance of the internal paths of your SoC; generation of cache misses is essential to verify coherency but slows down performance. Recently we’ve been working on generating test cases consisting only of memory-to-memory copies and CRC-based result checks. These dense, multi-threaded, multiprocessor test cases really stress the CPUs, buses/fabrics, and memory controllers in your SoC. The left-hand side of the image below is a screen capture of a test case running as displayed by TrekBox. This view shows the check and copy operations as scheduled by TrekSoC in a four-CPU SoC. The colored arrows show the dependencies, for example which checks verify the results of which copies. Green operations have completed, yellow operations are currently executing, and blue operations have yet to run. TrekSoC schedules the test case making assumptions (under user guidance) about how long each step will take. Of course, the actual run times will vary depending upon such factors as resource contention, channel saturation, and memory refresh. TrekBox keep track of the start and end of each operation, and at the end of the test displays the actual duration. This is shown in the screenshot in the right half of the image below. This information enables direct computation of latency performance metrics. Since the amount of data involved in each operation is known, bandwidth metrics can also be calculated. The user can simply click a button and TrekBox will output the performance metrics into a comma-separated value (CSV) file suitable for import to a spreadsheet. The figure before shows the spreadsheet generated for the example above, with the raw data as well as duration and bandwidth graphs. Since the checks involve computation of CRC values, they take more time than the memory-to-memory copy operations. Since both types of operations involved data payloads of similar size, the copies therefore achieve higher bandwidth (data/time) than the checks. This example comes from simulation, but TrekBox coordinates activity in all verification platforms. Therefore, we provide this same performance analysis, based upon the actual runtime of the test cases, for in-circuit emulation (ICE), FPGA prototypes, and actual silicon. We believe that delivering on the vision of portable stimulus requires automated generation of appropriate stimulus, checks, coverage, and performance metrics tuned to every platform. We announced and demonstrated this new performance analysis capability at the recent Design Automation Conference (DAC), and it is one key aspect of SoC performance. As another example, a protocol-specific TrekApp could provide metrics expressly for USB 3.0 or another standard of interest. We’re very interested in your feedback on this post, your thoughts on the importance of performance verification, and any suggestions that you have for other metrics of interest for your SoC designs. Tom Anderson The truth is out there … sometimes it’s in a blog. Tags: acceleration, applications, apps, bandwidth, Breker, cache coherency, coverage, duration, EDA, emulation, FPGA prototyping, functional verification, graph, latency, performance, performance analysis, portable stimulus, reuse, scenario model, simulation, SoC verification, throughput, transactional, TrekApp, TrekBox, TrekSoC, TrekSoC-Si, UVC, uvm Warning: Undefined variable $user_ID in /www/www10/htdocs/blogs/wp-content/themes/ibs_default/comments.php on line 83 You must be logged in to post a comment. |
|
|
|||||
|
|
|||||
|
|||||


