The Breker Trekker Tom Anderson, VP of Marketing
Tom Anderson is vice president of Marketing for Breker Verification Systems. He previously served as Product Management Group Director for Advanced Verification Solutions at Cadence, Technical Marketing Director in the Verification Group at Synopsys and Vice President of Applications Engineering at … More » Mystic Secrets of the Graph – Part ThreeDecember 10th, 2015 by Tom Anderson, VP of Marketing
The past two weeks, we’ve been having a bit of fun playing alchemist and letting readers in on some of the deep, dark secrets of graph-based verification technology. This week, we conclude the series by showing some additional capabilities for our scenario models that are easy to control and view in a graph visualization. Our point is, of course, that graphs are a natural way to represent data flow and verification intent with no advanced degrees from MIT, IIT, or Hogwarts required. As a quick reminder, graph-based scenario models begin with the end in mind and show all possible paths to create each possible outcome for the design. They look much like a reversed data-flow diagram, with outcomes on the left and inputs on the right. Breker’s Trek family can traverse the graph from left to right, randomizing selections to automatically generate test cases tailored to run in any target platform. Today, we continue using our example of a scenario model to verify that an automobile can move forward or stop.
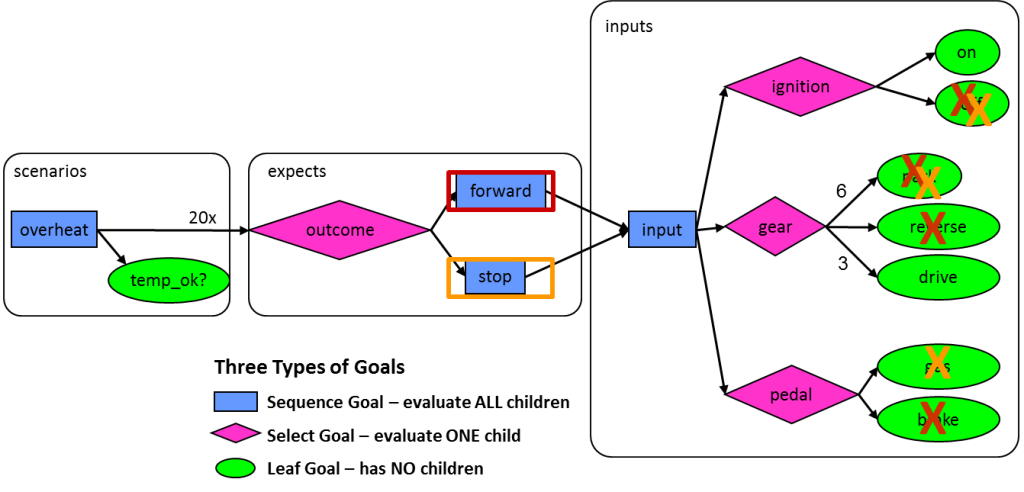
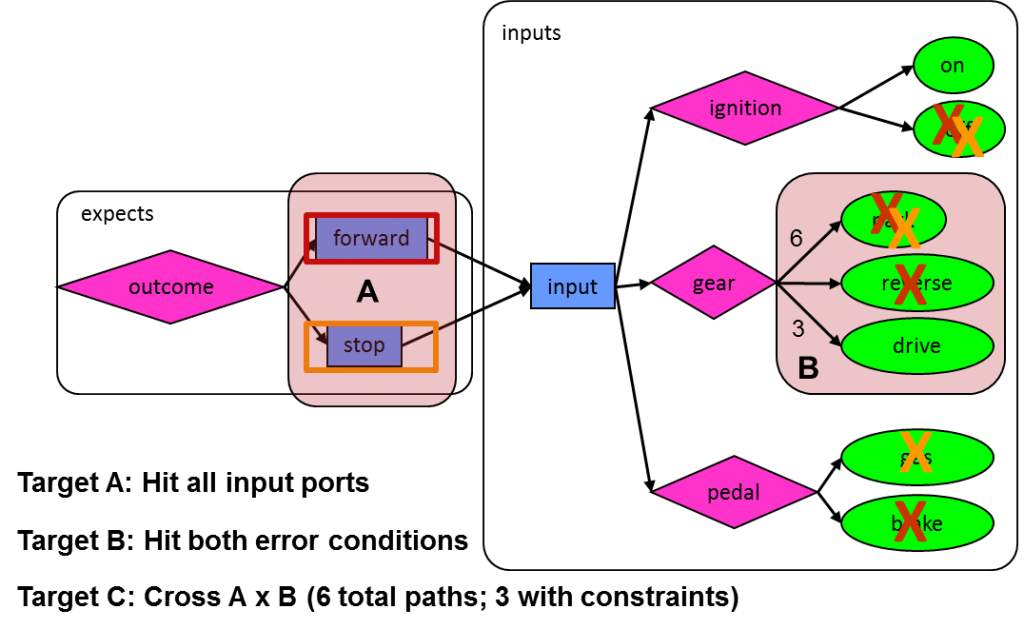
In our last post, we showed how graph constraints can dramatically reduce the size of the graph by guiding the traversal and test case generation to follow only legal paths. Portions of the graph related to incomplete portions of the design being verified can be constrained away, and selections can be biased so that the generation of test cases focuses on the areas of most interest to the verification team. These capabilities give you a high degree of control over how the graph is leveraged to verify your design. Graphs are inherently hierarchical; graphs for IP blocks can simply be plugged together to form models for higher levels of the design. Graphs can be built incrementally, focusing first on basic operations and then refined to explore verification corner cases. Graphs can also be expanded to add system-level functionality such as power control and security control on top of the regular operations. For example, you might want to re-run a test case for your design with all legal on/off combinations of power domains. In the case of our car scenario model, we might want to add a system-level check that strings together a series of test cases to see whether the car might overheat. The following graph uses an iteration count to repeat the regular test cases 20 times (randomly selecting forward and stop scenarios) and then checks for overheating. This demonstrates both the ability to combine multiple test cases into a longer one and to overlay system-level verification scenarios. Our final topic for today, and for this series, is graph-based coverage. This is a more abstract view of verification thoroughness than more traditional metrics such as functional coverage, assertion coverage, and code coverage. Graphs enable true system-level coverage that represents real-world usage of the design. For example, someone buying a car wants to be sure that it has been verified to be able to stop while moving in both forward and reverse. The following graph has been annotated to show three realistic coverage targets. Target A is that both the forward and stop modes will be exercised over the course of the generated test cases; target B is that all three settings of the gears will be tried. It is natural for you to specify and view these coverage specifications on a graph. Target C is an example of cross-coverage, specifying that all combinations of targets A and B will be exercised. In the absence of constraints, there would be six (two times three) such combinations, but the constraints we added last week reduce the legal combinations to three. You could also specify that the test cases must hit particular graph nodes, or a particular path comprising a series of nodes. You could even specify that all nodes and all paths must be exercised. The best part of graph-based system-level coverage is that it can be closed automatically. Unlike constrained-random stimulus pushing on a rope, the Trek generator will produce test cases guaranteed to hit the specified targets. Of all the advantages of graphs we have discussed, this is one of the most important. Finally, note that we transform system-level coverage into SystemVerilog cover groups and output the results. You can then import our system-level coverage into your existing coverage viewer (simulator, verification planner, Verdi, etc.) to combine it with the traditional coverage metrics. This closes the loop; you start with a graph-based scenario model that represents your verification intent and we report the results against your coverage-based verification plan. This may not be a mystic secret of graphs, but it’s another example of the tremendous power they bring to your verification projects. Tom A. The truth is out there … sometimes it’s in a blog. Tags: Accellera, Breker, constraints, cross-coverage, EDA, functional verification, goal, graph, graph-based, horizontal reuse, node, portable stimulus, PSWG, randomization, scenario model, scheduling, simulation, SoC verification, system-level coverage, test generator, Universal Verification Methodology, uvm, vertical reuse, VIP Warning: Undefined variable $user_ID in /www/www10/htdocs/blogs/wp-content/themes/ibs_default/comments.php on line 83 You must be logged in to post a comment. |
|
|
|||||
|
|
|||||
|
|||||


