


The Breker Trekker Tom Anderson, VP of Marketing
Tom Anderson is vice president of Marketing for Breker Verification Systems. He previously served as Product Management Group Director for Advanced Verification Solutions at Cadence, Technical Marketing Director in the Verification Group at Synopsys and Vice President of Applications Engineering at … More » Coverage from Running SoC Silicon? How Is That Possible?April 1st, 2014 by Tom Anderson, VP of Marketing
In our last post, we discussed some details of the demo that we showed at the DVCon and SNUG Silicon Valley events, in which TrekSoC-Si generated a test case, downloaded it into a commercial SoC (a TI OMAP4430 with dual ARM cores), and ran it in the actual chip. Our focus last time was on Breker’s unique visualization for the multi-threaded, multi-processor test cases that we generate. Specifically, we provide the same display for a test case running in silicon as we do for one running in simulation or simulation acceleration. Even more interesting is our ability to display coverage information for test cases running in silicon. You might think that this is impossible unless we’re building coverage structures into the SoC that you fabricate. Customers have been known to build specific types of coverage metrics into their hardware, for example real-time monitoring of bus bandwidth and SoC performance. But that’s not what we’re doing; we can gather highly accurate system-level overage without changing the design a bit.
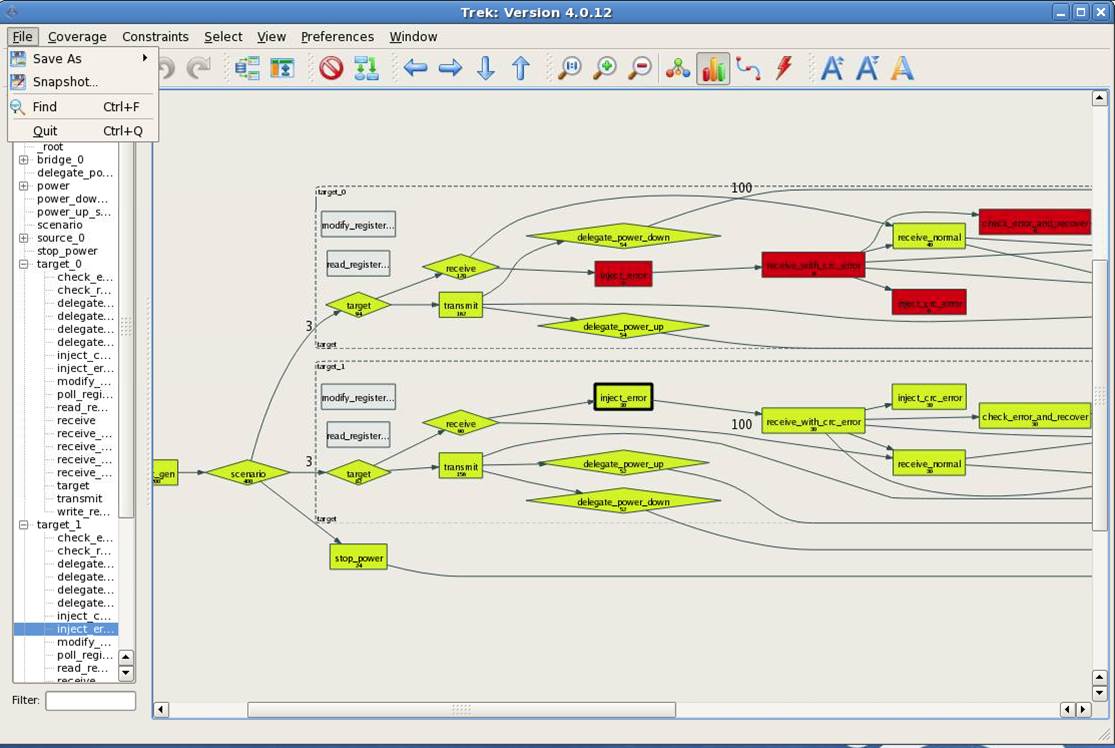
What’s our secret? The answer lies in the graph-based scenario models that TrekSoC-Si (and TrekSoC) use to generate the test cases to run on the embedded processors. Scenario models are a very powerful way to capture the SoC data flow, design intent, and verification space. Scenario models also capture system coverage; perhaps it’s most accurate to say that a coverage model can be automatically extracted from a scenario model. If you think about a graph, you might want to know whether the generated test cases have covered every goal (node) in the graph, or whether they have covered sequences of goals (paths). You might want to know whether every path through the graph has been covered, although this is unlikely on a full-SoC graph that may have 10100 paths. You might also check for cross-coverage metrics, such as whether every combination of packet type and packet length has been run through a networking design. TrekSoC and TrekSoC track and display all of these coverage types and more. Using a color scheme that you can easily customize, we can display a color-coded graph showing which goals and paths have been hit. In the following example, the goals colored yellow are considered moderately exercised (per your color choices) while the red goals have not been hit at all in the test cases generated so far:
Note that the information provided represents true system-level metrics. The paths correspond to realistic use cases that represent the way the SoC is used to perform applications. In the digital camera SoC example we discussed a couple of weeks ago, one path through the top-level scenario model is capturing a raw image from the camera, JPEG-encoding it in the photo processor, and writing it to the SD card. Not covering this path would mean that you missed a critical use case. At this point, perhaps you see the value of system-level coverage and how a graph-based scenario model is an ideal way to represent it. You probably can imagine us generating some sort of coverage monitor that you run in simulation along with our generated test cases. But that’s not what we’re doing, either. Generating a monitor for simulation is unnecessary and, as noted earlier, would not work for silicon unless we built it into the hardware. The secret here is that we can predict system-level coverage with 100% certainly when we generate the test cases. Scenario models are graphs, so we can explore them completely and understand every path that we have and have not walked through the graph in the process of generating test cases. We display the coverage results before you even run, whether in simulation, silicon, or any platform in between. You will achieve that exact coverage once you’ve actually run the test cases. So that’s how we get coverage information from test cases running in silicon, for example within the OMAP chip in our demo. The predictive, definitive nature of graphs enables a solution that’s impossible with traditional testbenches. Liked closed-loop coverage, generation-time coverage is a unique feature of Breker’s scenario models. In future posts we’ll talk about reachability analysis, graph constraints, and other related topics. Tom A. The truth is out there … sometimes it’s in a blog. Please request our TrekSoC-Si x86 server verification case study at: www.brekersystems.com/case-study-request/ Tags: Breker, dvcon, EDA, emulation, functional verification, goals, graph, paths, reuse, scenario model, silicon, simulation, SNUG, SoC verification, system coverage, TrekSoC, use cases Warning: Undefined variable $user_ID in /www/www10/htdocs/blogs/wp-content/themes/ibs_default/comments.php on line 83 You must be logged in to post a comment. |
|
|
|||||
|
|
|||||
|
|||||


 Animation, 3D Art and 3D Models")