The Breker Trekker Tom Anderson, VP of Marketing
Tom Anderson is vice president of Marketing for Breker Verification Systems. He previously served as Product Management Group Director for Advanced Verification Solutions at Cadence, Technical Marketing Director in the Verification Group at Synopsys and Vice President of Applications Engineering at … More » Making Verification Debug Less PainfulFebruary 18th, 2014 by Tom Anderson, VP of Marketing
In our last post, we discussed the results of a survey by Wilson Research Group and Mentor Graphics. Among other interesting statistics, we learned that verification engineers spend 36% of their time on debug. This seems consistent with both previous surveys and general industry wisdom. As SoC designs get larger and more complex, the verification effort grows much faster than the design effort. The term “verification gap” seems to be on the lips of just about every industry observer and analyst. We noted that debug can be separated into three categories: hardware, software, and infrastructure. Hardware debug involves tracking down an error in the design, usually in the RTL code. Software debug is needed when a coding mistake in production software prevents proper function. Verification infrastructure–testbenches and models of all kinds–may also contain bugs that need to be diagnosed and fixed. As promised, this post discusses some of the ways that Breker can help in all three areas.
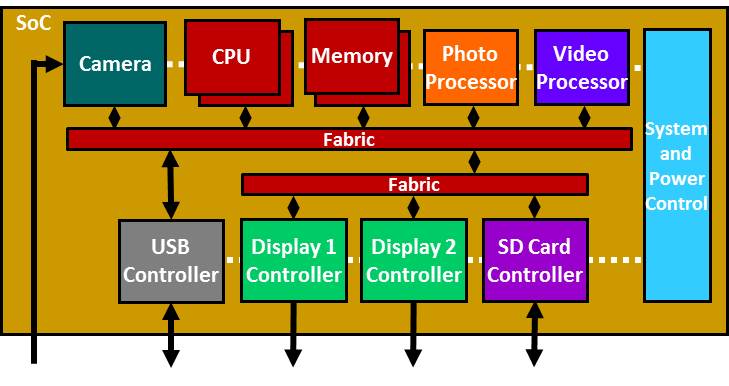
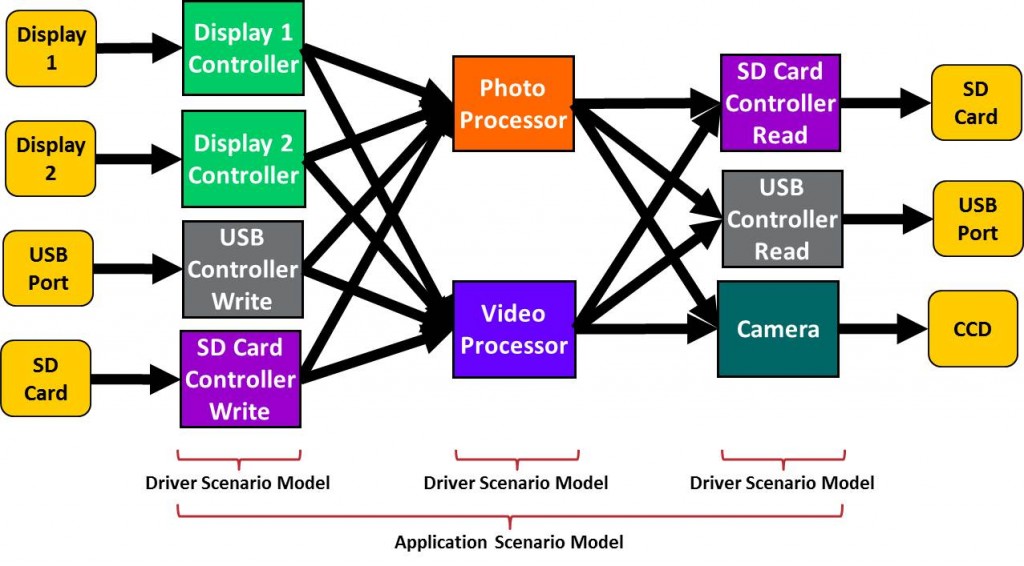
Breker’s Trek-SoC and TrekSoC-Si products are primarily focused on finding bugs in the RTL design before the SoC is fabricated. Thorough pre-silicon verification is critical when a mask set can cost millions and the result of a slipped product schedule could mean billions in lost revenue. As a reminder, Breker’s approach is to use graph-based scenario models to automatically generate C test cases that run on the SoC’s embedded processors in every stage of SoC verification. When a test case fails, the verification engineer needs to debug the failure to identify the bug and, often in consultation with the original designer, fix it in the RTL description. With hand-written tests, this is relatively easy since the verification engineers know exactly what the test is supposed to do. Of course, hand-written tests don’t scale to the full-chip level and so most testbenches are built on constrained-random stimulus following the rules and guidelines of the Universal Verification Methodology (UVM). Although the UVM has many benefits, in practice it’s often hard to figure out what is happening in its tests as they run. There is no clear link between the design specification or design intent and the test code. Thus, debug can be quite challenging. In contrast, when the Breker tools generate a test case they provide an interactive display showing run-time progress in terms that relate directly back to the graph-based scenario model and the user’s design intent. As an example, consider a digital camera SoC with the following block diagram and top-level scenario model: The test cases generated by Breker’s tools exercise the design using realistic use cases representative of the applications for the end product. Each such use case is called an application scenario and is composed of driver scenarios for each of the individual IP blocks that must be chained together to produce the use case. Examples of application scenarios include:
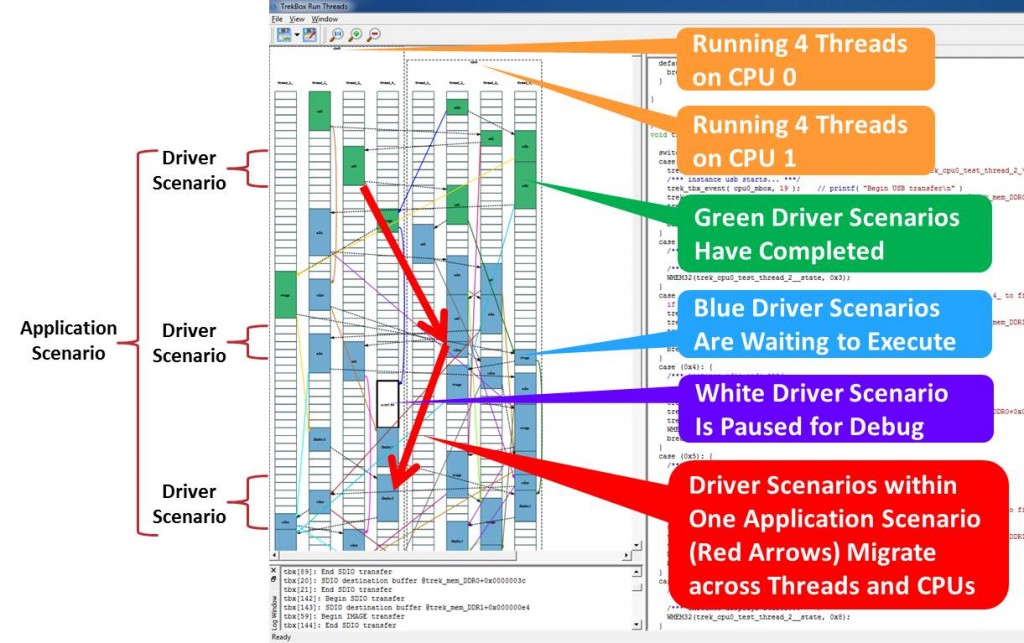
The generated test case will have many application scenarios running in series, with multiple threads or multiple CPUs running in parallel to the extent that the SoC architecture allows. The camera chip has two multi-threaded processors, so a significant amount of concurrency can be obtained. The following screen shot from TrekSoC’s runtime TrekBox utility shows multiple scenarios running on four threads for each of the two processors: The red arrows highlight a particular application scenario that entails reading a JPEG image from the USB port, decoding it, and displaying in on screen #2. Note that this scenario, like the others in this test case, migrates from thread to thread and processor in order to maximize stress on the SoC buses, memories, and caches. Because Breker generates C code, all the usual code debug resources are available in addition to the RTL simulator. In the above screen shot, an error has occurred in one of the application scenarios and so the test case has paused. At this point the verification engineer can probe the RTL or the testbench code to try to find out the source of the bug, and can also examine the generated test case using any preferred C development environment. Although Breker’s primary mission is uncovering RTL bugs, in practice users also find many errors in their verification models and in driver libraries called from the scenario models. Regardless of where the actual error occurred–hardware, software, or verification infrastructure–the detailed status provided by the TrekSoC/TrekSoC-Si log, the visualization of the runtime TrekBox display, and the tight interaction between the RTL simulation and the C test case all make debug much less painful. A future post will examine some other aspects of easing debug made possible by the Breker approach. Tom A. The truth is out there … sometimes it’s in a blog. Please request our new x86 server case study at www.brekersystems.com/case-study-request/ Tags: Breker, constrained-random, EDA, functional verification, graph, IP, reuse, scenario model, simulation, SoC verification, TrekSoC, TrekSoC-Si, use cases, uvm Warning: Undefined variable $user_ID in /www/www10/htdocs/blogs/wp-content/themes/ibs_default/comments.php on line 83 You must be logged in to post a comment. |
|
|
|||||
|
|
|||||
|
|||||


