The Breker Trekker Tom Anderson, VP of Marketing
Tom Anderson is vice president of Marketing for Breker Verification Systems. He previously served as Product Management Group Director for Advanced Verification Solutions at Cadence, Technical Marketing Director in the Verification Group at Synopsys and Vice President of Applications Engineering at … More » Mystic Secrets of the Graph – Part OneNovember 24th, 2015 by Tom Anderson, VP of Marketing
If there’s one thing that Breker is known for, it’s the use of graphs for verification. From our earliest days, we harnessed the abstraction and expressive power of graph-based scenario models to capture the verification space, many aspects of the verification plan, and critical coverage metrics. As we reported in a post a few weeks ago, it looks certain that the industry will follow our lead and base the upcoming standard from Accellera‘s Portable Stimulus Working Group (PSWG) on a graph representation. As discussions have proceeded both within the PSWG and informally with interested parties, it has become clear that “graph” may not mean the same thing to all people. Our view of graphs is precisely defined in a way that makes it easy for users to create them and feasible for our tools to generated complex, multiprocessor test cases from them. Most of the key concepts can be communicated easily by the use of a familiar example, which we will begin in today’s post and continue next week.
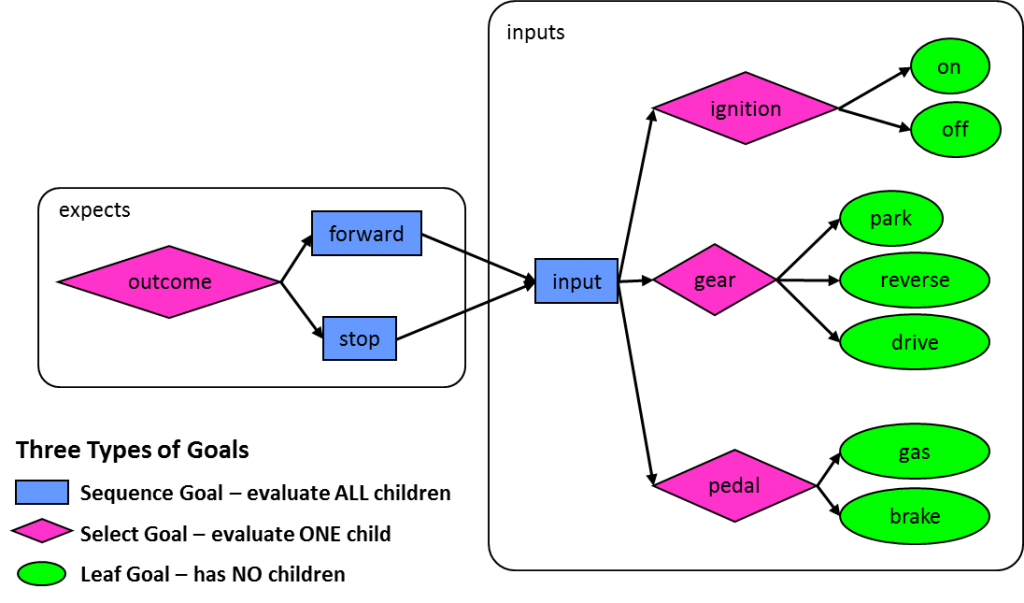
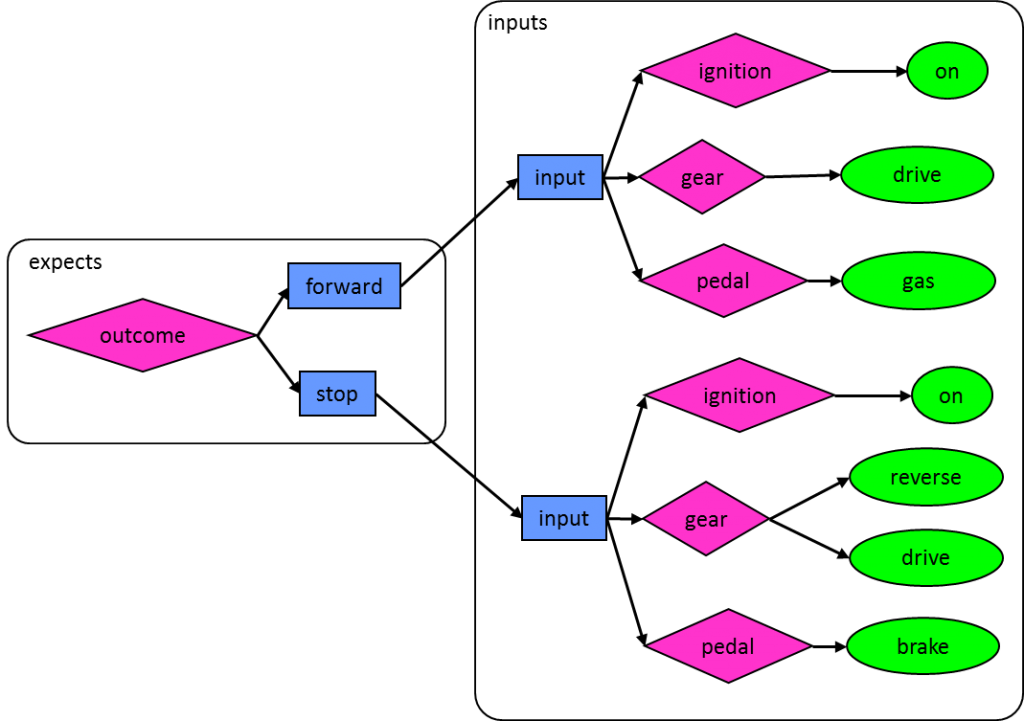
This example is actually one that we’ve been using for several years in presentations and in training, but we feel that sharing it with a wider audience will foster appreciation for the power of graphs and de-mystify them as well. Graph-based scenario models are really quite simple in concept: they begin with the end in mind and show all possible paths to create each possibly outcome for the design. Thus, they look much like a reversed data-flow diagram, with outcomes on the left and inputs on the right. Consider this graph to verify part of the operation of an automobile: In this graph, the goal is to verify that the car can move forward and can stop. Moving from left to right, you can choose one of the two possible outcomes at the outcome “select goal” and then set the values for three inputs in sequence. The ignition can be on or off to start the test, the (automatic) transmission can be in park, reverse, or drive, and either the gas or brake pedal can be pressed. At this level of abstraction, the graph defines all possible inputs that must be considered to produce the desired outcomes. An automated tool from our Trek family can walk through this graph from left to right, building a test case that applies the specified inputs and checks that the outcome matches the intention of the test. For example, the generated test might turn the ignition on, set the gear for forward, apply the brake, and check that the car stops. One key to the power of a graph-based model is that all possible scenarios are captured. For each walk through the graph, a different test case is generated. We’ll discuss in a future post how to know when you have generated enough test cases. Many of you will spot right away the problem with this particular graph. If a tool walks through this graph from left to right and chooses freely at each select node, some of the generated test cases will make no sense. For example, running a test with the ignition turned off will test neither forward movement nor stopping. Only certain paths through this graph make sense as test cases given the verification space specified. There are two ways to resolve this by keeping graph traversal and test case generation on only sensible paths. The first is by expanding the graph so that only legal paths are shown for each outcome: This new graph is no longer very interesting since the only real decisions being made are the outcome and, in the case of stopping, whether the car is moving forward or in reverse before the brake is applied. However, it does allow only sensible and legal paths to be traversed and used to generate test cases. Expansion of this sort is catastrophic in a graph for a complex design such as a system-on-chip (SoC). The number of goals (graph nodes) can explode quickly, degrading the performance of the test generator. Our next post will show how graph constraints control path exploration and test case generation without having to duplicate portions of the graph. There are many other topics that can be illustrated using this simple automotive example, including adding functionality to the graph, biasing selections, stringing together test cases, measuring coverage, and adding system-level scenarios. We will cover all of these in future posts. In the meantime, please comment and let us know if you have any thoughts or questions. Tom A. The truth is out there … sometimes it’s in a blog. Tags: Accellera, Breker, EDA, functional verification, goal, graph, graph-based, horizontal reuse, node, portable stimulus, PSWG, randomization, scenario model, scheduling, simulation, SoC verification, test generator, Universal Verification Methodology, uvm, vertical reuse, VIP Warning: Undefined variable $user_ID in /www/www10/htdocs/blogs/wp-content/themes/ibs_default/comments.php on line 83 You must be logged in to post a comment. |
|
|
|||||
|
|
|||||
|
|||||


