


Bridging the Frontier Bob Smith, Executive Director
Bob Smith is Executive Director of the ESD Alliance responsible for its management and operations. Previously, Bob was senior vice president of Marketing and Business Development at Uniquify, responsible for brand development, positioning, strategy and business development activities. Bob began his … More » Revenue Increase Offers Welcome News to Start 2020January 9th, 2020 by Bob Smith, Executive Director
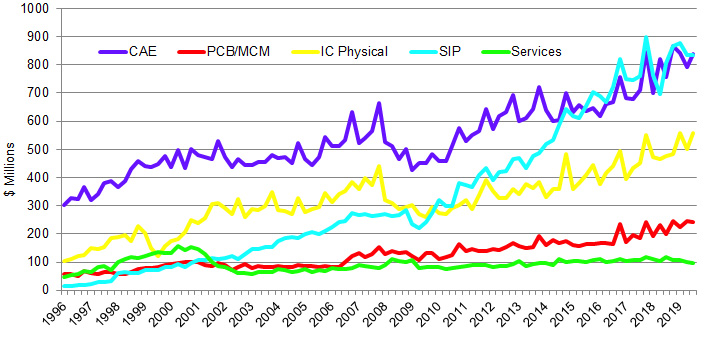
The electronic system design ecosystem, our segment of the electronic product supply chain, started 2020 with some welcome news –– revenue increased 8.9 percent for Q3 2019 to $2567.7 million, compared to $2358.3 million in Q3 2018. The four-quarters moving average, a comparison of the most recent four quarters to the prior four quarters, increased by 6.8 percent. The quarterly Market Statistics Service (MSS) report is a mainstay of our various initiatives offered to our members. Reports are published approximately three months after quarter close and detail industry revenue data from public and private companies who confidentially contribute to it. Reports are segmented by product category (CAE, PCB/MCM Layout, IC Physical Design & Verification, and SIP) and region (the Americas, Europe Middle East and Africa, Japan, and Asia Pacific). Each includes numerous sub-categories. Reports include the current year-to-date information along with the previous three years data to provide members with data to guide engineering and business decisions. Members tell us they use it to effectively gauge the health of a specific category as they consider new product development efforts. The historical data gives guidance on whether growth in a category is indicative of a long-term trend or a one-quarter anomaly. As well, the report tracks total employment of the reporting companies. In Q3 2019, they employed 44,950 professionals in Q3 2019, an increase of 6.6 percent compared to the 42,162 employed in Q3 2018, and up 1.4 percent compared to Q2 2019. Digging a bit deeper into the revenue by product category, this quarter’s largest category –– Computer Aided Engineering (CAE) –– generated revenue of $838.3 million in Q3 2019, a 10.8 percent increase compared to Q3 2018. The four-quarters moving average for CAE increased 7.0 percent. Semiconductor Intellectual Property (SIP) is a close second in Q3, with revenue totaling $835.9 million, a 3.7 percent increase compared to Q3 2018. The four-quarters moving average increased 7.9 percent. IC Physical Design and Verification revenue was $557.6 million in Q3 2019, a 17.2 percent increase compared to Q3 2018. The four-quarters moving average increased 6.9 percent. Printed Circuit Board and Multi-Chip Module (PCB & MCM) revenue of $240.5 million for Q3 2019 represents an increase of 19.8 percent compared to Q3 2018. The four-quarters moving average for PCB & MCM increased 10.3 percent. Services revenue was $95.4 million in Q3 2019, a decrease of 19.9 percent compared to Q3 2018. The four-quarters moving average decreased 9.9 percent.
Caption: The figure shows the historical revenue for the major categories (CAE, PCB & MCM, IC Physical Design and Verification, SIP and Services) from Q1 1996 through Q3 2019. Looking more carefully at the total revenue from various regions, the Americas is the largest region. That region purchased $1169.9 million of design-related products and services in Q3 2019, an increase of 10.4 percent compared to Q3 2018. The four-quarters moving average for the Americas increased 1.0 percent. Revenue in Europe, the Middle East, and Africa (EMEA) increased 0.1 percent in Q3 2019 compared to Q3 2018 on revenues of $351.1 million. The EMEA four-quarters moving average decreased 2.3 percent. Third quarter 2019 revenue from Japan decreased 9.4 percent to $219.3 million compared to Q3 2018. The four-quarters moving average for Japan decreased 5.7 percent. The Asia/Pacific (APAC) region revenue increased to $827.5 million in Q3 2019, an increase of 5.7 percent compared to the third quarter of 2018. The four-quarters moving average increased 13.5 percent. Of course, I’m giving you only a snapshot of the MSS Report. As I noted above, the complete report is available quarterly to our members. For more information about our Market Statistics Service, contact Committee Chair Paul Cohen, senior manager at the ESD Alliance and SEMI. He can be reached at pcohen@semi.org. Or, contact me at bsmith@semi.org to learn more about the ESD Alliance and all of our other initiatives. As the latest MSS report gives us a positive outlook for 2020, look for more good news from the ESD Alliance soon. Engage with the ESD Alliance at: Website: www.esd-alliance.org ESD Alliance Bridging the Frontier blog: http://bit.ly/2oJUVzl Twitter: @ESDAlliance |
|
|
|||||
|
|
|||||
|
|||||


 Animation, 3D Art and 3D Models")