Bridging the Frontier Bob Smith, Executive Director
Bob Smith is Executive Director of the ESD Alliance responsible for its management and operations. Previously, Bob was senior vice president of Marketing and Business Development at Uniquify, responsible for brand development, positioning, strategy and business development activities. Bob began his … More » Twenty Years of the ESD Alliance’s Market Statistics ServiceMay 9th, 2017 by Bob Smith, Executive Director
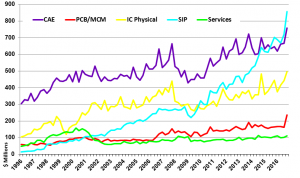
One of the most popular and enduring programs the ESD Alliance offers its members is the quarterly Market Statistics Service (MSS) report containing detailed revenue data for the EDA, Semiconductor IP and design services industries. The report compiles data submitted confidentially by public and private EDA and semiconductor IP companies into tables and charts listing the data by product category and geographic region. I use “enduring” because the MSS began in 1996 under the careful guidance and tireless efforts of Wally Rhines, Chairman and CEO of Mentor, a Siemens Business, and the MSS’ board sponsor. According to Wally, Mentor contributes data and benefits from the MSS report and has done so since its inception. He noted in a viewpoint for an ESD Alliance newsletter “the data is an important part of our business intelligence.” Popular … because it is popular, timely and invaluable. Many of our members, especially the smaller companies, don’t have the resources for a custom survey to understand the total available market for their products or which region will offer the best return on investment. Detailed product categories help companies understand trends in their market segment, not just the overall industry, or explore adjacent markets to grow their product lines. Corporate executives, investors and project managers must have quantitative data to access viable markets, support their planning activities and build the all-important yearly budget. Each MSS report includes revenue details for the current year-to-date and the previous three years by quarter, providing data highlighting overall trends and quarterly fluctuations that can affect the semiconductor market and our members’ business. Member companies submit their financial information confidentially to an independent accounting firm. Individual company data is not reported and steps are taken to protect individual data for categories with a small number of reporting companies. Contributing data is free of charge and contributors receive the quarterly MSS executive summary report. The full report is available to ESD Alliance member companies and contains more detailed information about industry revenues by category and region. The most recent MSS issued in March offered several positive signs for members of the Alliance. It reported EDA industry revenue increased 18.9 percent for Q42016 to $2455 million, compared to $2064.5 million in Q4 2015. The four-quarters moving average, which compares the most recent four quarters to the prior four quarters, increased by 9.2 percent. Semiconductor IP went from an almost non-existent category to the largest single category. Revenue totaled $856.4 million in Q4 2016, a 22 percent increase compared to Q4 2015. The four-quarters moving average increased 13.5 percent. Services revenue was $110.1 million in Q4 2016, an increase of 2.8 percent compared to Q4 2015. The four-quarters moving average increased 2.3 percent. Also, the EDA industry reported double-digit growth for Q4 in all four geographic regions –– the Americas, Europe, Middle East and Africa (EMEA), Japan and Asia/Pacific. EMEA saw a revenue spike in Q4. Whether it’s an anomaly or the beginning of a trend is worth tracking. Of note as well is the Asia/Pacific region. It went from a small region to the second largest behind the Americas. And one more interesting statistic comes under the category of employment. Companies taking part in the survey employed 36,412 professionals in Q4 2016, an increase of 6.6 percent compared to the 34,169 people employed in Q4 2015 and up 2.5 percent compared to Q3 2016. For more information, see the news release issued March 27 or the latest MSS Newsletter. The MSS report is just one of the many benefits afforded members of the ESD Alliance. If your company would like to join the ESD Alliance, please visit the ESD Alliance website to read about our committees and ongoing initiatives. I’m always available to answer questions and can be reached at bob@esd-alliance.org. |
|
|
|||||
|
|
|||||
|
|||||


